13.1 Capital investment
13.1.1 Fixed capital cost estimation for plant facilities
A fixed capital investment is regarded as the capital needed to provide all the depreciable facilities. It is divided into two classes by defining battery limits and auxiliary facilities for the project.

The boundary for battery limits includes the following:
- Sites
- Site Clearing
- Grading
- Roads
- Fence
- Parking Areas
- Landscaping
- Process buildings
- Substructure
- Superstructure
- Platforms
- Supports
- Stairways
- Hoists
- Elevators
- Utilities plants
- Boilers
- Incinerators
- Air Plant
- Refrigeration Plant
- Electrical Sub station
- Effluent Outfall
- Cooling towers
- Process equipments
- Heat Exchangers
- Pumps
- Columns
- Driers
- Pressure Vessels
- Storage Vessels
- Reactors
- Agitators
- Filters
- Storage facilities
- Water Storage
- Tank Farm Areas
- Silos
- Ware Houses
- Emergency facilities
- Fire Hydrants
- Sprinklers
- Emergency Shelters
- Medical Center
13.1.2 Working capital
During the life of a project, from the early stages of process development through to construction, capital and operating cost estimates are prepared in order to establish and ensure its commercial viability. The level of accuracy of these estimates increases with each subsequent stage.
Capital costs are mainly derived from the cost of each item of equipment, using suitable factors that allow for civil and electrical work, piping, instrumentation etc. Considerable research has been done in arriving at these factors. The estimates are supported by an equipment database that covers most items of metallurgical plant, which is updated regularly.
The economic viability of any process depends to a large extent on the operating or production cost. Estimates of these costs are usually given in terms of total annual cost, or of cost per unit of product. The operating costs are made up of variable and fixed costs, which are estimated individually.
Before any major project is undertaken, a financial analysis and sensitivity analysis must be made. The sensitivity analysis is a measure of the profitability of an operation.
The working capital cost of a process usually includes the items listed below:
- Raw materials inventory for plant start up
- In-process inventory which includes raw materials, intermediate and finished product
- Maintenance and repair inventory to take care of day today operations
- Accounts receivable credit carry-over which includes credit extended to customers and given by suppliers
- Minimum cash reserve for emergencies
13.2 Total product costs
It includes the manufacturing cost and the general expenses.
Manufacturing costs
- Raw material
- Shipping containers
- Operating costs
- Operating labor
- Operating supervision
- Operating supplies
- Utilities
- Electricity
- Steam
- Water
- Fuel
- Control laboratory
- Miscellaneous
- Overhead costs
- Employee benefit
- Medical service
- Cafeteria
- Purchasing
- Shops
- Property protection
- General plant supervision
- Depreciation
- Property taxes and insurance
General expenses
- Freight and delivery
- Administrative expense
- Sales expense
- Research expense
13.3 Economic analysis
The chemical engineer is concerned with the selection of conditions, which will yield a maximum return on investment for the plant he is designing. The reason why one finds a set of variables chosen in a given process or one process favored over another is frequently based on optimizing the economic balance.
As an example of economic balance, we can look at the optimum design of a heat exchanger as a familiar equipment-sizing problem. Increasing the fluid velocity in the tubes of a shell-and-tube exchanger will increase the heat transfer coefficient and reduce the size of the exchanger for a given capacity. This will reduce the annual charges on the fixed investment of the heat exchanger. As a counter-balancing effect, the increased velocity will call for increased pumping costs. A minimum operating cost is found which fixes the conditions for design of the heat exchanger as seen in figure 13.1.

Optimum operating cost
Optimum cost is dependent on the selling price and the Profitability factors.
Selling price
Market analysis
- Price-volume relationship, present and anticipated
- Application of products
- Competition
Income taxes
It is the revenue to be paid to the government based on the applicable tax structure.
Net and new earnings
Profitability
The profitability of a venture is influenced by the ratios mentioned below.
- Return on investment
- Cost and profit charts
Other methods of economic analysis
- Pay-out time
- Accounting method
- Investor’s method
- Project present worth
The capital and total product costs are estimated from process and mechanical design flow sheets and specifications, once a market and sales analysis has been conducted to establish the annual plant capacity.
The latter is a function of a marketing analysis group, composed of engineers and economists who have developed methods of forecasting production statistics and demands for chemicals under consideration for manufacture. To fully appreciate the problems encountered in marketing and sales forecasting, a study of any process industry must include a discussion of competition and use patterns characteristic of that industry.
Choice between alternative processes
In the case of many major chemical products, there is variety of alternative routes available to a potential producer depending on the cost and availability of raw materials, power etc. Hence, to arrive at an economic process route under the exiting conditions, it is always beneficial to study various manufacturing methods. Once the optimum scheme is finalized, the associated cost factors can be worked out.
13.4 Life cycle analysis
When performing a cost analysis on a chemical process, usual considerations include the total installed cost of the plant and the annual operating costs. Many various costs are included in these two cost divisions. Unfortunately, other important costs have often been omitted due to the difficulty involved in predicting them. However, with today’s advanced testing methods and a significant chemical process history to learn from, these “new” costs can be estimated with a higher degree of confidence than in the past.
Life cycle costs may include the following:
- Maintenance cost to alter design
- Labor cost involved with maintenance
- Losses from ceased production or off-grade product
- Salvage value of the plant
Figure 13.2 shows a graphical representation of the process of considering different chemical process configurations:

Chemical process configurations
In conducting a life cycle cost analysis, it is possible to find correlations from testing that resemble figure below. Rather than considering initial costs only and assuming that the equipment or material will perform well throughout the plant life, chemical engineers are beginning to consistently look at the “overall” big picture.

Material choices
In figure 13.3, Material 1 is less expensive than Material 2, but at a future time it must be replaced with Material 1 or a comparable material. Therefore, the cost of using Material 1 is actually the cost of Material 1 + cost of Material 2. These are the sort of scenarios that life cycle cost analysis is designed to prevent because the cost associated with changing design specifications is often significant.
13.5 Real-Time Optimization (RTO) of chemical processes
Chemical process industries are increasingly compelled to operate profitably in a very dynamic and global market. The increasing competition in the international arena and stringent product requirements mean decreasing profit margins unless plant operations are optimized dynamically to adapt to the changing market conditions and to reduce the operating cost. Hence, the importance of real-time or on-line optimization of an entire plant is rapidly increasing.
Real-Time Optimization (RTO) refers to evaluation and alteration of operating conditions of a process continually so as to maximize the economic productivity of the process. Plant measurements collected via the distributed control system are first checked for steady state operation. If the plant is at steady state, reconciliation and gross error detection are performed on the measured data, and the process model is updated based on reconciled data. Rigorous optimization is then carried out using the updated model along with the economic data and product requirements, to find the new set points for the operating variables. The new set points are now passed to the distributed control system for implementing on the plant.
Reliable methods for various steps such as data rectification, optimization in RTO are generally available. Distributed control systems are present in many chemical process industries, and computing power for RTO is inexpensive. One major issue in the use of RTO appears to be the process model, which requires considerable effort and expertise. RTO has been mainly carried out by a few industries, and consequently most information is not easily accessible or documented.
The following RTO applications reported in the open literature are of interest to numerous chemical industries:
- Hydro cracker fractionation plant
- Olefins plant
- Power plant optimization of a refinery
These and other reported applications indicate that 5 to 10 full cycles of RTO are performed per day, and the payback period for RTO is typically less than a year.
Several new and existing plants in the World are increasingly opting for RTO. Greater benefits are obviously obtained by plant-wide optimization and/or by RTO. In the near future, RTO could become an integral part of the design of a new plant. Few researchers have interest and expertise in the different components of RTO, and would like to collaborate with the industry on RTO application to a process of interest and relevance. At the present state of development, RTO needs to be studied using a realistic example incorporating practical conditions, limitations and scenarios in order to gain meaningful experience. Industry can gain valuable experience on RTO through this collaboration with minimal contribution.
Appendix A
Periodic table

Appendix B
Fundamental physical constants


Appendix C
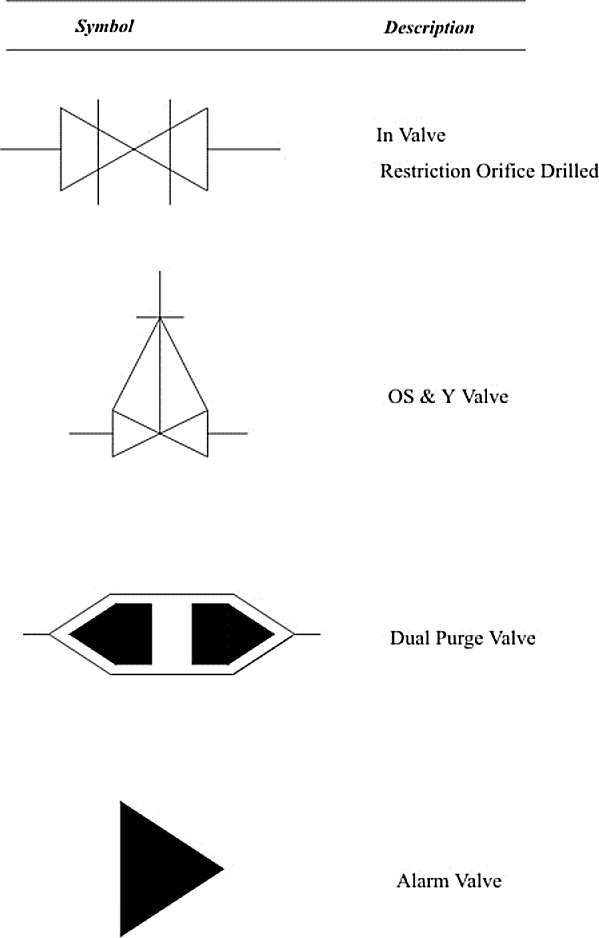
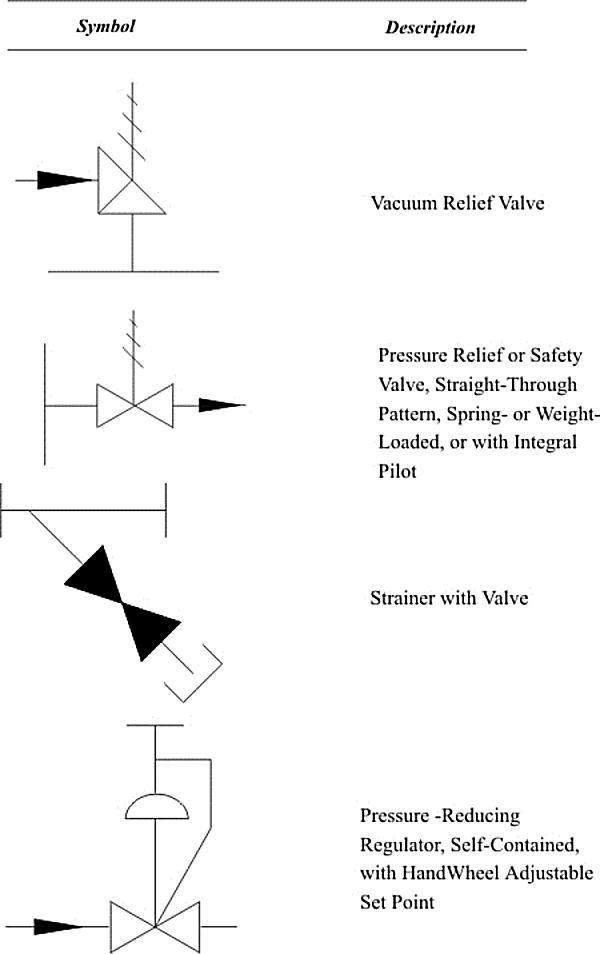
Process equipment symbols


Appendix D
Typical instrumentation representation


Appendix E
Typical P&ID

Appendix F
Typical process data sheet
